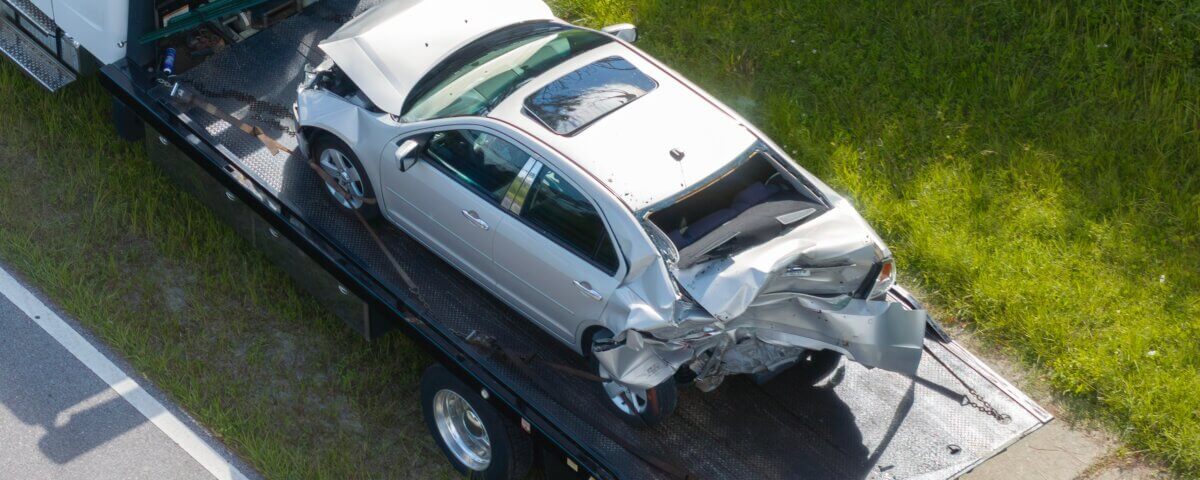
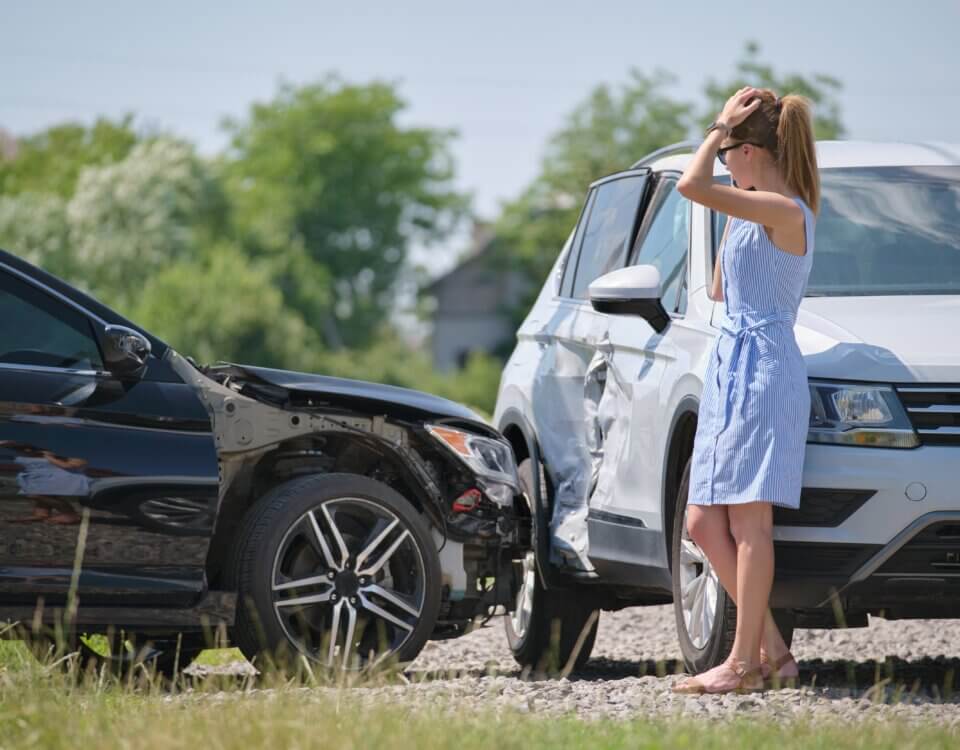
Car accidents remain one of the leading causes of injuries and fatalities in California. Despite advances in road safety, the Golden State continues to see high numbers of crashes every year due to traffic congestion, distracted driving, and impaired drivers. Staying informed about the latest accident statistics helps drivers, passengers, and pedestrians understand the risks on the road and why legal representation is often critical after a crash.
Below are 25 shocking car accident statistics in California for 2025, backed by recent studies and government data.
General Car Accident Statistics
- California reports over 200,000 car accidents annually. (See statewide traffic data: https://www.ots.ca.gov/)
- Los Angeles County alone accounts for more than 20% of statewide crashes.
- California ranks second in the nation for traffic fatalities, behind Texas.
- Speeding contributes to over 30% of all fatal crashes in the state.
- The average economic loss per crash victim exceeds $15,000 in medical bills and lost wages.
Distracted Driving Statistics
- Texting while driving causes nearly 10% of all crashes in California.
- Drivers under 25 are the most likely to be involved in distraction-related accidents.
- Over 55% of drivers admit to using their phones while driving despite laws against it.
- Distracted driving fatalities have increased by 12% since 2020. (Source: https://www.nhtsa.gov/)
DUI / Impaired Driving Statistics
- Alcohol-impaired driving causes over 1,000 deaths annually in California.
- Nearly 1 in 3 traffic fatalities in the state involves alcohol.
- Marijuana-related crashes have doubled since legalization. (Data reference: https://www.cdc.gov/)
- Friday and Saturday nights are the most dangerous times for DUI crashes.
Motorcycle & Truck Accidents
- California has the highest number of registered motorcycles in the U.S.
- Motorcyclists are 28 times more likely to die in a crash compared to drivers of passenger cars.
- Truck accidents account for 11% of all fatal crashes in California.
- Freeways like the I-5, I-10, and I-405 rank among the deadliest in the country for large-truck accidents.
Pedestrian & Bicycle Accident Statistics
- California leads the nation in pedestrian fatalities, averaging over 1,100 per year.
- Nearly 75% of pedestrian deaths occur at night.
- Bicycle accidents have increased by 20% over the last five years in urban areas like Los Angeles and San Francisco.
- More than 80% of fatal pedestrian crashes happen at non-intersection locations.
Legal & Claims Statistics
- The average personal injury settlement for car accident victims in California is around $21,000–$30,000.
- Victims represented by attorneys receive settlements that are on average 3.5 times higher than those without legal representation.
- Insurance companies deny or delay payments in up to 40% of serious accident claims.
- It takes an average of 12–18 months to resolve a personal injury lawsuit related to a car accident.
Final Thoughts
These statistics paint a clear picture: California roads are some of the most dangerous in the nation. If you or a loved one is injured in a crash, the numbers show that having the right legal team can significantly increase your chances of receiving fair compensation. At Hillstone Law, we fight for accident victims across California so you can focus on healing while we handle the insurance companies and legal process.
Note: These blog posts are created solely for the use of Hillstone Law. The information is gathered from internet research, publicly available sources, and artificial intelligence (AI) tools such as ChatGPT. While we aim to share helpful and educational content, Hillstone Law does not independently verify every detail. Some information may be incomplete, outdated, or subject to change without notice. If you believe any part of a post is inaccurate, misleading, or infringes upon copyright, please contact Hillstone Law immediately so we can review it and take appropriate action, including correction or removal.
Disclaimer: The material provided in these blogs is for general informational purposes only and should not be considered legal advice. Reading these posts does not create, and is not intended to create, an attorney-client relationship with Hillstone Law. Our intent is to share knowledge, raise awareness, and provide helpful resources to the public; however, Hillstone Law makes no warranties or guarantees about the accuracy, completeness, or reliability of the information provided, and expressly disclaims liability for any actions taken in reliance on it. The photos used in these posts are for illustrative purposes only and do not depict actual clients, individuals, or incidents unless expressly stated. If you or a loved one has been injured in an accident, please contact Hillstone Law at (855) 691-1691. Our attorneys are available to answer your legal questions and help you understand your rights.


